Series Fun
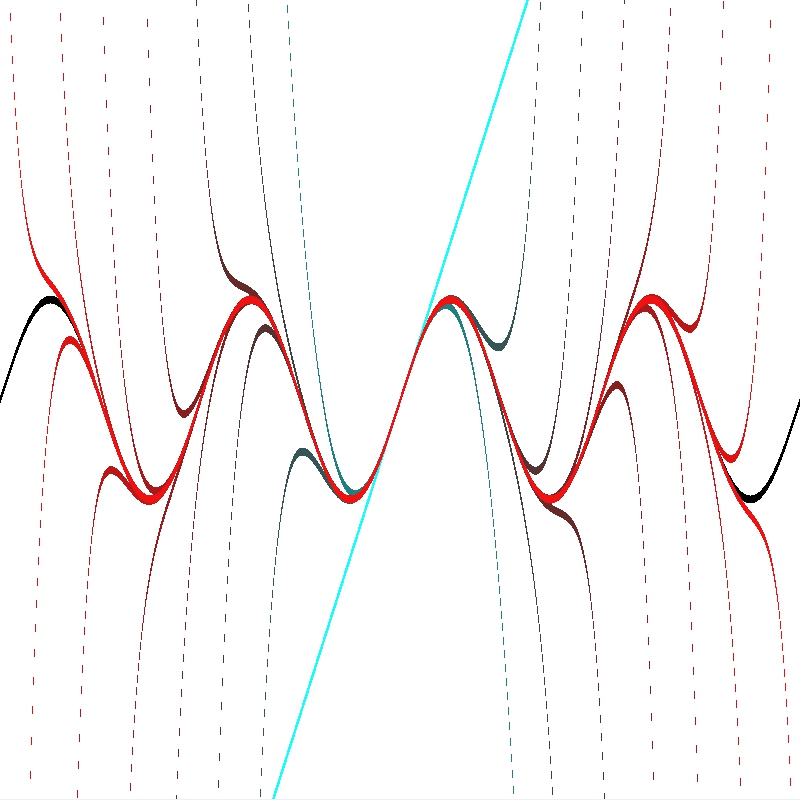
Around the middle of March 2012 when we were covering series in Calculus class I got the idea to make a short Python program to approximate sine. I got a bit carried away and came up with this:
from tkinter import *
from math import *

def getSinSeriesApprox(x, n):
    return sum([(((-1)**(i+1))*(x**(i*2-1)))/factorial(i*2-1) for i in range(1, n+1)])

def draw_graph(y, curr_y, pixel_color, line_color=(0,0,0), line_width=0.01):
    if abs(curr_y - y) < line_width:
        pixel_color[:] = line_color[:]

def simple_display(spacex, spacey):
    #little graphy thing:
    pixel_color = [0, 0, 0]
    line_width = 0.01
    x = spacex*pi*4
    y = sin(x)*.25
    draw_graph(y, spacey, pixel_color)
    number = 15
    for i in range(1, number):
        y2 = getSinSeriesApprox(x, i)*.25
        r = (255/number)*i #increasing
        g = 255/i #decreasing
        b = 255/i #decreasing
        draw_graph(y2, spacey, pixel_color, line_color=(r, g, b))
    return tuple(pixel_color)

def set_pixel(image, location, color):
    image.put("#%02x%02x%02x" % color, location)

def slowfill(image, color):
    for y in range(image.height()):
        for x in range(image.width()):
            set_pixel(image, (x,y), color)


#layout of (spacex, spacey)
#        y
#        1
#        |
#        |
#-1 -----|----- 1 x
#        |
#        |
#       -1

def make_image(image, function):
    for y in range(image.height()):
        half_y = image.height()/2
        space_y = (-y+half_y)/half_y
        for x in range(image.width()):
            half_x = image.width()/2
            space_x = (x-half_x)/half_x
            set_pixel(image, (x,y), simple_display(space_x, space_y))

root = Tk()
image = PhotoImage(width = 200, height = 200)
slowfill(image, (255,255,255))

make_image(image, simple_display)

label = Label(root, image=image)
label.grid()

root.mainloop()
True, there’s quite a bit that could be compressed in this code, but most of that doesn’t really matter. The guts of the program boil down to a nice simple one-line function:
def getSinSeriesApprox(x, n):
    return sum([(((-1)**(i+1))*(x**(i*2-1)))/factorial(i*2-1) for i in range(1, n+1)])
…and that’s why math is beautiful (but Python can take some of the credit for the compactness).

Fifteen McLaurin sine series worked out to differing degrees can look nice when graphed next to an actual sine curve (also the simple home-brewed graphing setup made it look particularly nice). The graphing part of the program is actually terribly slow because I wrote it in PyTK. I would’ve normally used Python Imaging Library, but at the time a version for Py3k was nowhere to be found.